
Will Rogers Phenomenon and Simpson's Paradox Explained With Numbers, Plus Non-Probability Sampling Bias
- Statistical illusions come from how data is grouped, not from wrong numbers.
- The Will Rogers phenomenon and Simpson's paradox both show grouping changing results.
- Non-probability samples limit generalisation, as famous US and UK polls show.
Contents
A statistical illusion happens when nothing is wrong with the data, but the way it is split or combined leads to a conclusion that does not match reality. The Will Rogers phenomenon and Simpson's paradox are the two classic examples: in both, the choice of how to group the data changes the result. This guide, adapted from a Korean statistics study note, works through both with numbers, compares four types of non-probability sampling, lists where students go wrong, and shows how the same traps appear in American and British polling and medical research.
What is a statistical illusion?
Every average hides a choice about who is counted together. When you split a population into subgroups, move people between groups, or add subgroups of very different sizes, the averages can move in ways that feel impossible. No one has lied and no number is wrong, yet the headline conclusion can be the opposite of what is happening to individuals.
Student money tip from CampusDown Repair UpIs a small leak worth a renters insurance claim? How to decide — compare the loss with your deductible, check who is responsible, and document it either way.
Sampling raises a second, related problem. If the people you measure are not chosen by chance, even a perfectly calculated average describes only the people you happened to reach. Both problems come down to the same question: who is in the group, and why?

Why does the Will Rogers phenomenon happen?
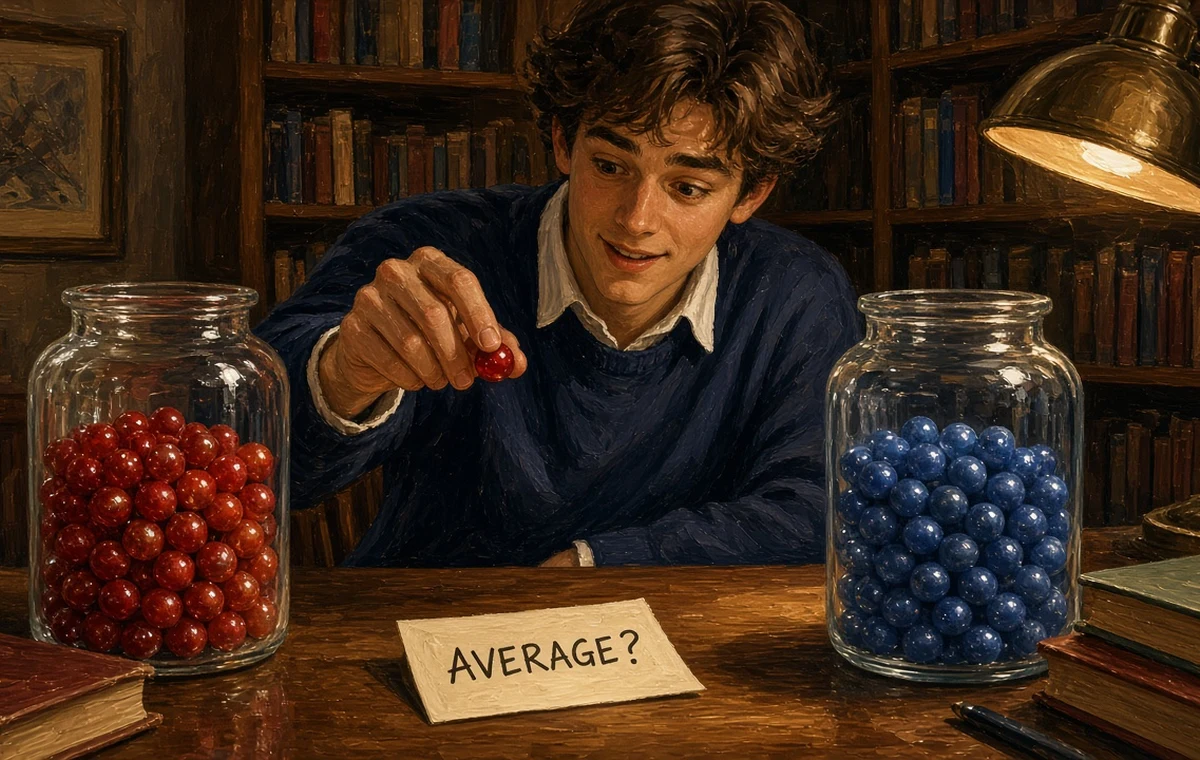
The name comes from a joke attributed to the humorist Will Rogers about people moving from one state to another and raising the average intelligence of both. It works when a member whose value is below the average of the group it leaves, but above the average of the group it joins, changes groups. The group it leaves loses a below-average value, so its mean rises; the group it joins gains an above-average value, so its mean rises too.
The Korean source describes the mover as one of the higher-scoring members of the group it leaves, which is not quite right: if a member above that group's average left, its average would fall. The mover has to sit below the average of the group it leaves and above the average of the group it joins.
| Step | Group A | Group B |
|---|---|---|
| Before | 50, 60, 70 (mean 60) | 20, 30, 40 (mean 30) |
| Move the 50 from A to B | 60, 70 (mean 65) | 20, 30, 40, 50 (mean 35) |
| Result | Mean rises by 5 | Mean rises by 5 |
No individual improved, yet both averages went up. In medicine this is called stage migration: when better scans move borderline patients into a more severe cancer stage, survival can improve in every stage without any patient living longer.
Skimming the section headings first makes a long guide much easier to map out. Try writing down one question of your own as you read.
How does Simpson's paradox happen?
Simpson's paradox occurs when a trend that holds in every subgroup reverses once the subgroups are combined. It happens when the subgroups differ greatly in size and in their baseline rates, because a combined rate is an average weighted by how many cases each subgroup contributes. The principle and classic cases are covered in the wiki entry on Simpson's paradox.
| Stone size | Treatment A (open surgery) | Treatment B (keyhole procedure) |
|---|---|---|
| Small stones | 81 of 87 (93%) | 234 of 270 (87%) |
| Large stones | 192 of 263 (73%) | 55 of 80 (69%) |
| All patients | 273 of 350 (78%) | 289 of 350 (83%) |
Treatment A wins for small stones and for large stones, yet B looks better overall. The reason is that A was used mostly on the harder, large-stone cases. Always show subgroup results and sample sizes next to the total, and ask whether a hidden variable decides who ends up in which group.
What types of non-probability sampling are there?

In probability sampling every member of the population has a known chance of selection. Non-probability sampling gives up that guarantee for speed or access. The four common types are compared below, and the wiki entry on non-probability sampling explains when each is used.
| Type | How people are chosen | Main weakness |
|---|---|---|
| Convenience | Whoever is easiest to reach | Reachable people differ from the rest |
| Purposive (judgment) | The researcher picks typical or expert cases | Depends on the researcher's judgment |
| Quota | Fill set proportions such as age and gender | Matches on chosen traits only |
| Snowball | Participants recruit people they know | Networks of similar people |
None of the four supports broad generalisation, and all are open to researcher bias, but each has legitimate uses: pilot studies, hard-to-reach groups, or exploring a new topic. A strong comparison says when each method is reasonable and how to reduce its bias.
Where do students get stuck?
The most common problems are treating the two paradoxes as the same thing, explaining them only in words without a worked example, and describing non-probability sampling as simply wrong. A good presentation builds its own small dataset, calculates subgroup and combined averages in a spreadsheet, and shows in a table the condition under which the conclusion flips. Check that you separated the two causes, calculated an example yourself, showed subgroups with sample sizes, compared the four sampling types, and stated limits and remedies.
Where do these traps appear in the US and UK?
United States
The best-known American case of Simpson's paradox is the 1973 graduate admissions data at the University of California, Berkeley: men appeared to be admitted at a higher rate overall, but within most departments women did as well or better, because women applied more often to highly competitive departments. On the sampling side, the 1936 Literary Digest poll, built from lists of car and telephone owners and voluntary replies, wrongly predicted the presidential election, which is still taught as a warning about unrepresentative samples.
United Kingdom
After pre-election polls underestimated the Conservative lead at the 2015 general election, an inquiry commissioned by the British Polling Council and the Market Research Society concluded that the main cause was unrepresentative samples rather than late swings or dishonest answers. Pollsters responded by changing how they recruit and weight respondents. The Office for National Statistics, by contrast, relies on probability samples for its major social surveys.
| Case | Country | Lesson |
|---|---|---|
| Berkeley admissions, 1973 | United States | Combined rates can reverse subgroup patterns |
| Literary Digest poll, 1936 | United States | A huge sample can still be biased |
| General election polls, 2015 | United Kingdom | Unrepresentative samples mislead even experts |
Using a real case alongside your own small example shows that these are not classroom curiosities but problems that shape admissions debates, medical decisions and election coverage.
How should you finish the assignment?
This topic suits introductory statistics or social research methods assignments that ask you to explain statistical errors and sampling. Structure it as definition, Will Rogers phenomenon with numbers, Simpson's paradox with a table, the four sampling types, and a short critique of one real case.
Student money tip on CampusDown Repair Up: Is a small leak worth a renters insurance claim? How to decide.
As a final step, pick one statistic from the news and check whether either trap could be hiding in it. Textbooks name sampling methods slightly differently, so follow the terms your course uses.
- Statistical illusions come from how data is grouped, not from wrong numbers.
- Will Rogers: a member between the two averages moves, and both means rise.
- Simpson: unequal subgroup sizes can reverse a trend when combined.
- Non-probability samples limit generalisation but have valid uses.
- Berkeley 1973, Literary Digest 1936 and UK polls in 2015 are classic cases.
FAQ
What is the Will Rogers phenomenon?
Moving a member whose value lies between two group averages raises both averages, even though no individual changes.
What is Simpson's paradox?
A trend that holds in every subgroup reverses when the subgroups are combined, because subgroup sizes differ.
How are the two phenomena different?
Will Rogers is about moving members between groups; Simpson's paradox is about combining subgroups of unequal size.
What are the four types of non-probability sampling?
Convenience, purposive (judgment), quota and snowball sampling.
Is non-probability sampling always wrong?
No. It limits generalisation but is useful for pilot studies, hard-to-reach groups and exploratory research.